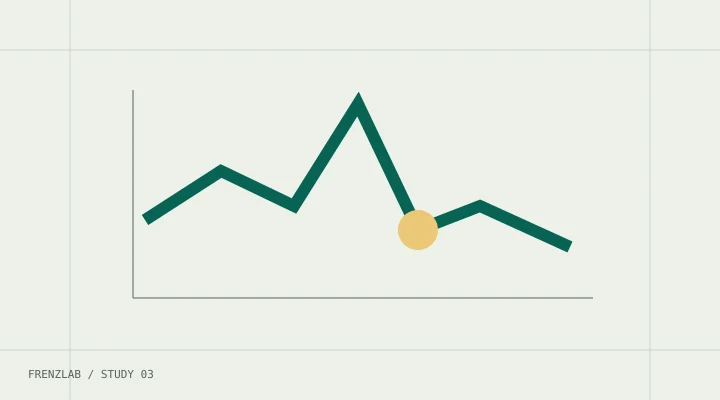
Write the comparison before explaining the decline
Begin with a sentence that names the metric, the two periods, and the content included. “Reach fell” is incomplete. “The first seven days of reach for four recent product tutorials was lower than the first seven days for four earlier product tutorials” is a comparison someone can inspect. It may still contain differences that matter, but it gives the investigation a defined starting point.
The reach drop diagnostic turns your answers into an investigation order. It cannot access an account, discover a hidden restriction, or assign a probability to a cause. Read its output as a checklist. The work of gathering records and testing whether they support a conclusion remains yours.
Do not start by changing the bio, deleting several posts, switching topics, and increasing frequency at the same time. That bundle of actions makes the next comparison harder to interpret. First establish what changed in the numbers, then decide what evidence could distinguish the possible explanations.
Confirm what the metric means
Record the exact label from the official analytics interface. Reach, impressions, views, and interactions should not be treated as synonyms. Their current definitions and availability need platform-specific confirmation. [VERIFY: Instagram Help Center — insights metrics and definitions — https://help.instagram.com/; TikTok Support — analytics and post insights — https://support.tiktok.com/]
If a report labels a value “views,” do not rename it “people reached” merely because that sounds clearer to a client. Keep the original label and attach the verified definition when you have checked it. When combining platforms, separate the rows until you know whether the underlying measures are comparable.
Use the engagement rate calculator for explicit arithmetic. It can calculate interactions divided by followers, reach, or impressions, but it does not confirm that your input actually represents the selected denominator. A correct formula applied to mislabeled numbers remains a misleading report.
Align the reporting windows
Compare posts at the same age whenever your records allow it. A two-day total and a thirty-day total do not describe equal observation periods. Also distinguish a calendar-month account summary from lifetime totals for posts published in that month. Those are different collections of data.
Imagine Post A has 4,000 views after thirty days and Post B has 800 after two. It is tempting to report an eighty-percent decline. But suppose Post A had 700 views after its first two days. The matching-age comparison is then 700 versus 800, an increase of approximately 14.29 percent. Neither comparison establishes a cause; the example shows why the observation window must be written down.
If you cannot obtain matching historical windows, state the limitation. Do not manufacture earlier values by dividing a lifetime total evenly across days. That assumes a distribution pattern you have not observed. Use the available records for a narrower conclusion, or start collecting a consistent series for future comparisons.
Separate totals from per-post measures
An account total can change because the number of posts changed. Work through that arithmetic before attributing the entire movement to distribution. Consider a month with eight posts and 800 interactions, followed by a month with three posts and 450 interactions. Total interactions fell 43.75 percent. Average interactions per post increased from 100 to 150, or fifty percent.
These calculations do not prove the second month was better. It may have different formats, paid activity, topics, or reporting ages. They show that “fewer interactions” and “less interaction per post” are different statements. Report whichever statement your evidence actually supports, and do not silently switch between them.
| Comparison | What to keep attached |
|---|---|
| Account total | Number of posts, dates, included surfaces |
| Per-post average | Sample size and how posts were selected |
| Engagement percentage | Numerator categories and denominator |
| New versus old content | Matching observation ages |
| Paid versus organic | Which activity belongs in each group |
A table like this is a working aid, not a statistical guarantee. It helps prevent a neat headline from hiding the difference between volume, efficiency, and distribution.
Check actual warnings before inventing hidden ones
If you received a notice, read its exact wording and the official next step. Distinguish a content-specific notice from an account-wide statement, and do not assume a warning explains every later performance change. Current status and eligibility information needs the platform's own documentation. [VERIFY: Instagram Help Center — Account Status and recommendation eligibility — https://help.instagram.com/; TikTok Support — account status and content violations — https://support.tiktok.com/]
The diagnostic prioritizes notices when you report one because they are concrete records to examine. That priority is not a causal verdict. A notice and a drop can occur near each other while other changes also affect the comparison. Keep both the notice review and the measurement review in your notes.
A public-handle scan is not evidence of a hidden restriction. Claims about what account data a platform exposes require current developer documentation. [VERIFY: Meta for Developers — Instagram Platform API reference — https://developers.facebook.com/docs/instagram-platform/; TikTok for Developers — API documentation — https://developers.tiktok.com/doc/] Frenzlab does not perform such a scan or sell an account-health score.
Build a small, useful comparison set
Choose posts that share the characteristics relevant to your question. If you want to investigate a format change, separate the formats and record the difference. If you want to investigate a topic change, avoid mixing that with a major change in production style without acknowledging both.
Suppose six earlier posts were short product demonstrations and six recent posts were long founder interviews. A difference between the groups cannot be cleanly described as the effect of posting time when format, topic, and length also changed. The result may justify a new question, but it does not isolate that variable.
Record your selection rule before choosing the examples. Otherwise it is easy to keep only the posts that support the story you already prefer. A useful private sheet includes post date, topic, format, measurement age, metric label, numerator if used, denominator, and a short note about unusual circumstances. Leave missing data blank and explain the gap.
Compare rates without manufacturing a benchmark
Use your own relevant baseline and state how it was calculated. An average of post percentages and a percentage based on pooled totals can differ when denominators differ. Neither should be mislabeled as the other.
For a simple example, Post A has ten interactions from a denominator of 100, giving ten percent. Post B has twenty interactions from 1,000, giving two percent. The mean of the two rates is six percent. Pooling gives thirty divided by 1,100 multiplied by 100, approximately 2.73 percent. The arithmetic answers two different summary questions.
Do not attach an invented niche benchmark to make the result feel more authoritative. If you use an external benchmark, record its source, date, population, formula, and limitations before comparing your account. This guide supplies no industry range because an unsupported range would add confidence without adding evidence.
Turn a hypothesis into a limited test
Write down one hypothesis you can examine. For example: “Our recent tutorials may be harder to understand in the first frame.” Then decide which observable feature you will change and which comparisons you will keep stable. The universal post preview can help inspect framing, but it cannot tell you whether framing caused a reach change.
Choose the evaluation window in advance. Keep the content purpose and format sufficiently similar for the result to be useful. Record the outcome even if it does not support your preferred explanation. A small test can inform the next editorial decision without proving a universal rule about an algorithm.
Avoid promising a client that a test will restore a particular number. Instead, explain what the test can clarify and what remains uncertain. If several changes must happen for practical reasons, document them. Real work rarely behaves like a controlled experiment, but that is a reason to qualify the conclusion, not to invent precision.
Report the result with the uncertainty intact
A useful report has four parts: the observed comparison, the limitations, the investigations completed, and the next action. For example, you might say that a recent group had lower matching-age reach, that its topic also changed, that no actual notice was found in the reviewed records, and that the next batch will test clearer opening frames. Each part can be checked independently.
Do not write “shadowban confirmed” or “algorithm penalty removed” without evidence that supports those specific claims. The absence of an explanation is not evidence for a hidden one. If access itself has failed, use the account recovery guide rather than mixing it into a performance report.
Keep a record of corrections when a metric definition, export, or arithmetic error changes your conclusion. Our editorial policy asks the same of published guidance. The goal is not to sound certain quickly. It is to give the creator or business a next step that is proportionate to the evidence actually available.
Decide when to stop investigating
Set a practical boundary for the current review. If the available records cannot distinguish the remaining explanations, document that limitation and choose a modest next test instead of repeatedly relabeling the same numbers. Keep producing useful work while you collect a better comparison set. A report can be valuable even when its conclusion is that the evidence is currently insufficient for a specific causal claim.