Write alt text for a chart shared on X
Describe the chart type, key trend, and essential values in a way that carries the point.
A chart image needs a description of what the data shows, not simply the word “chart.”
The problem behind the post
A reader who cannot see the image should not have to infer the trend from the caption alone. X's own guidance recommends capturing what matters, being clear and objective, and including important text. The alt description is a place to communicate the visual evidence while the post can explain why you are sharing it.
A practical way to handle it
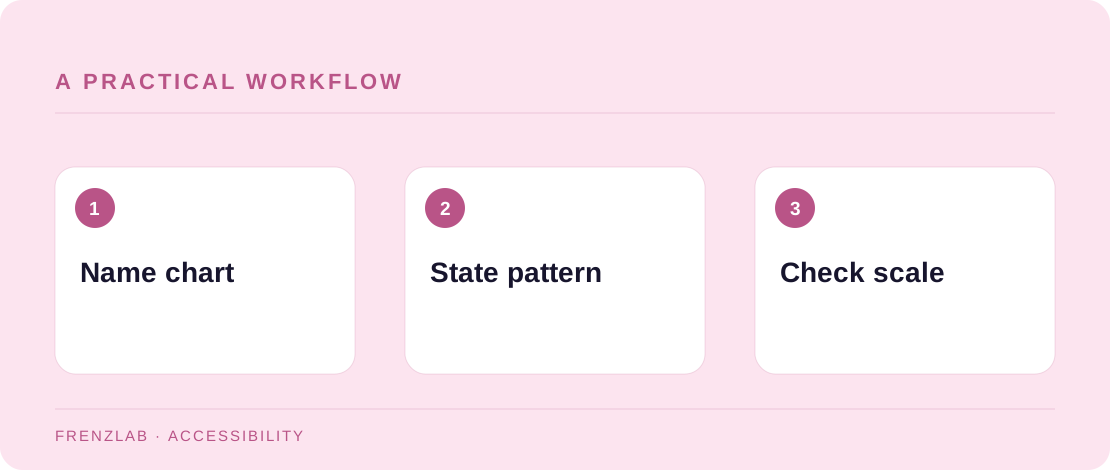
Identify the chart type, the measure, the time span or categories, and the primary comparison. If a single value supports the claim, include it. If the chart has many data points, link to an accessible table or write a text summary nearby rather than trying to squeeze the whole dataset into one description. Draft the key facts with the Alt Text Workshop and then read them without looking at the chart.
Check whether the post text already states the same numbers. Avoid repeating everything twice; the alt text can add the visual relationship or missing context. Name uncertainty and scale when they affect interpretation. For example, a line that appears steep because the axis begins above zero deserves a careful description.
A worked example
For a bar chart of monthly workshop signups, a useful description could be: “Bar chart comparing signups from May to August: 18, 21, 20, and 35. August is highest, while the earlier months are similar.” That gives the viewer the pattern and values. “Graph showing growth” would hide the dip and overstate the story.
Before you publish
- Can someone understand the takeaway without the image?
- Are the unit, timeframe, and important values named?
- Does the description avoid interpreting more than the data supports?
A common mistake
Do not turn a chart description into a marketing claim. If the data only shows correlation or a short period, say that. Accessible text should be as accurate as the visual, including its limitations.
Use the related Frenzlab tool to put this method into practice, then check the result in the destination platform.
Sources and further reading
Platform features and interfaces may change. These references were used to check the platform-specific details in this guide.
Practical, independently written guidance. If a step has changed, tell us so we can verify it.